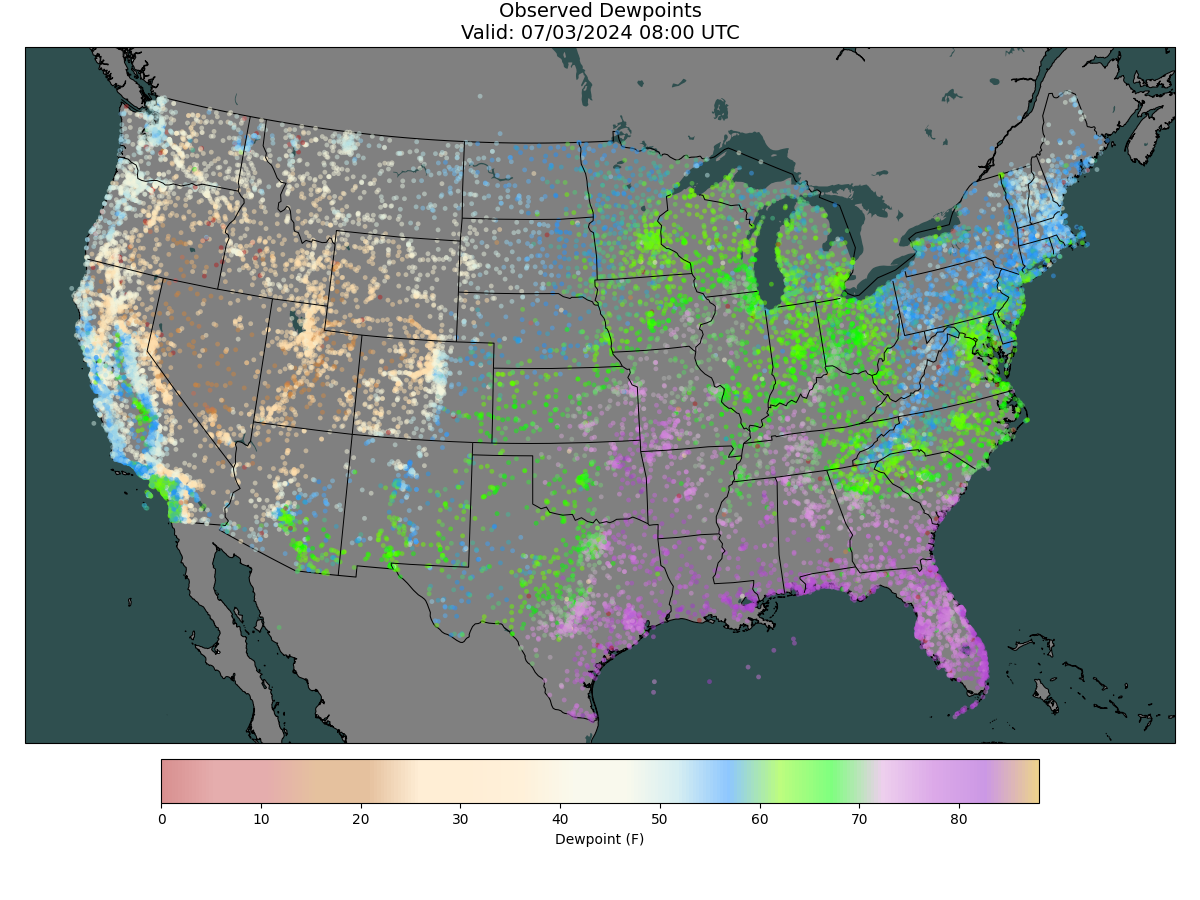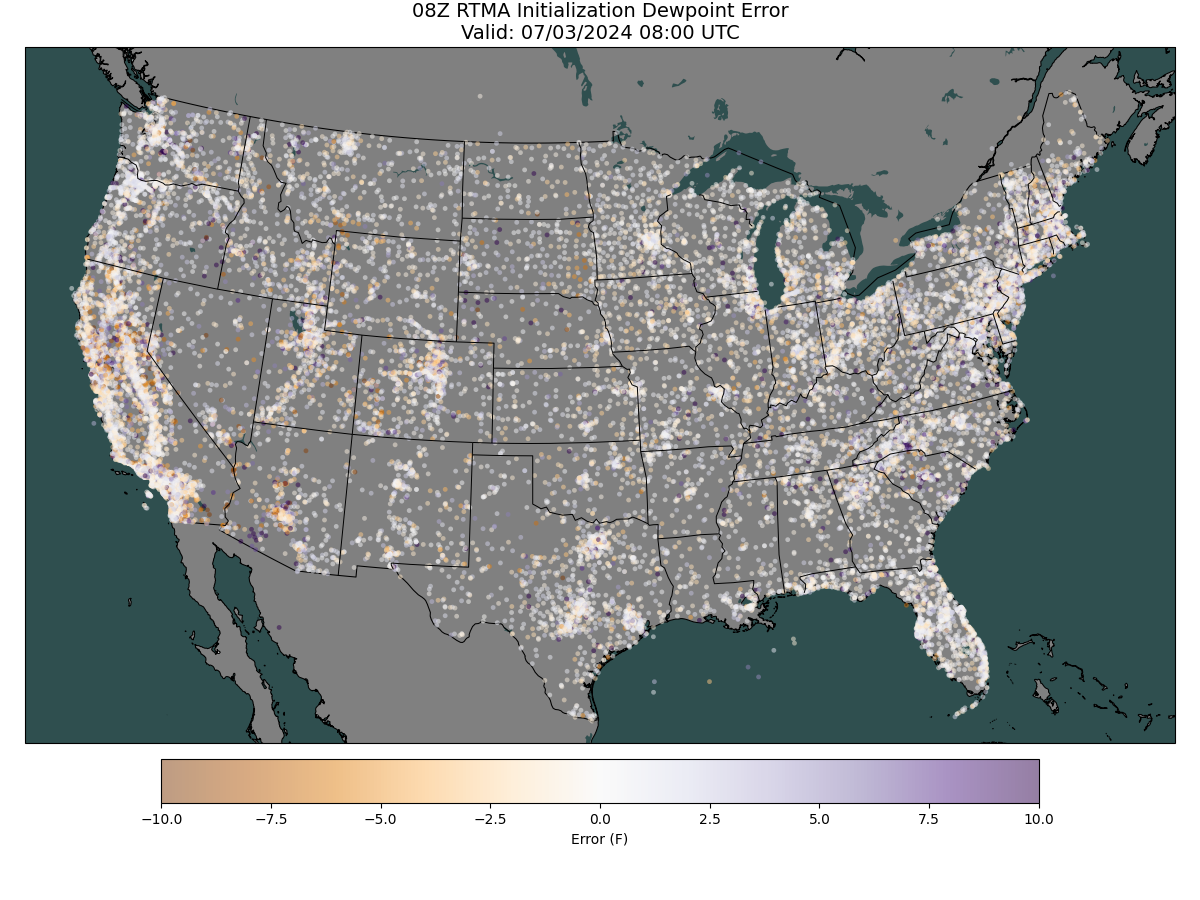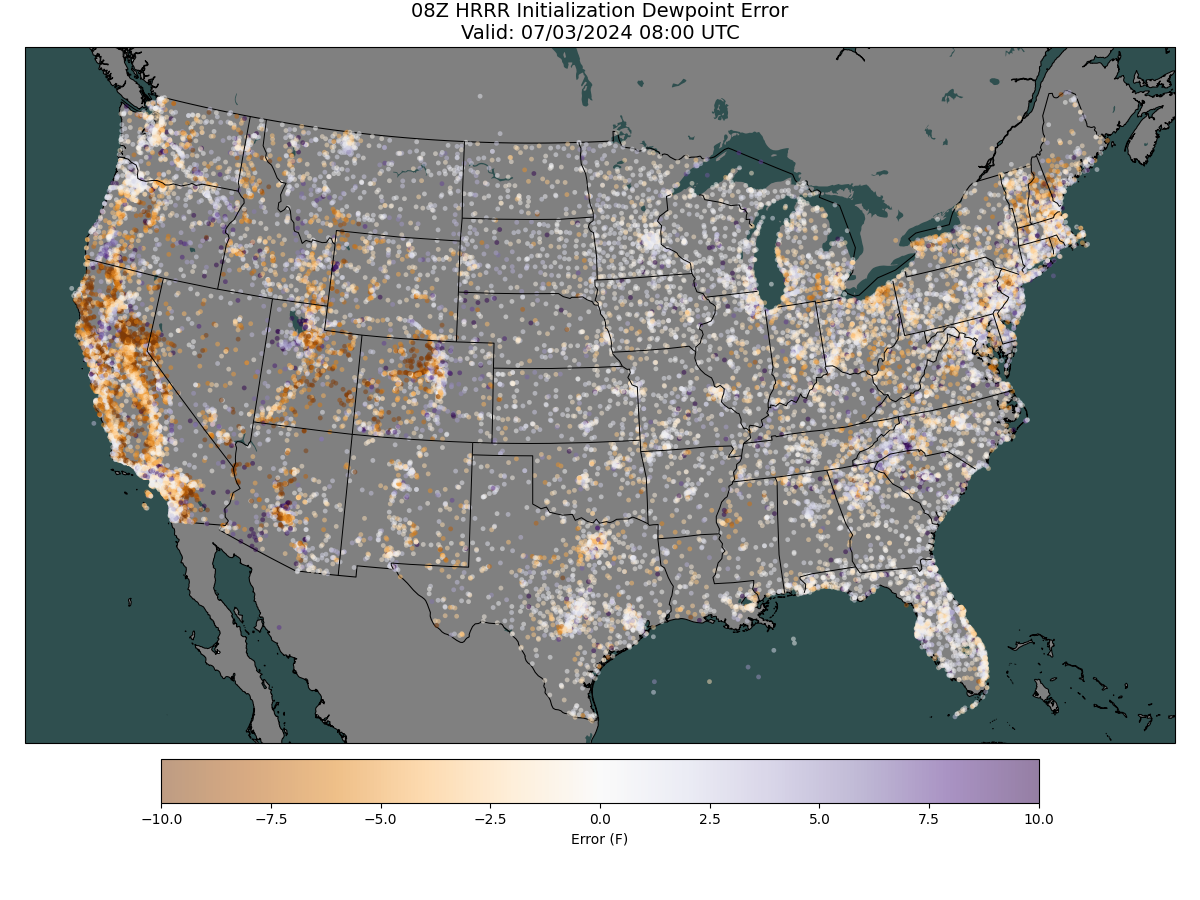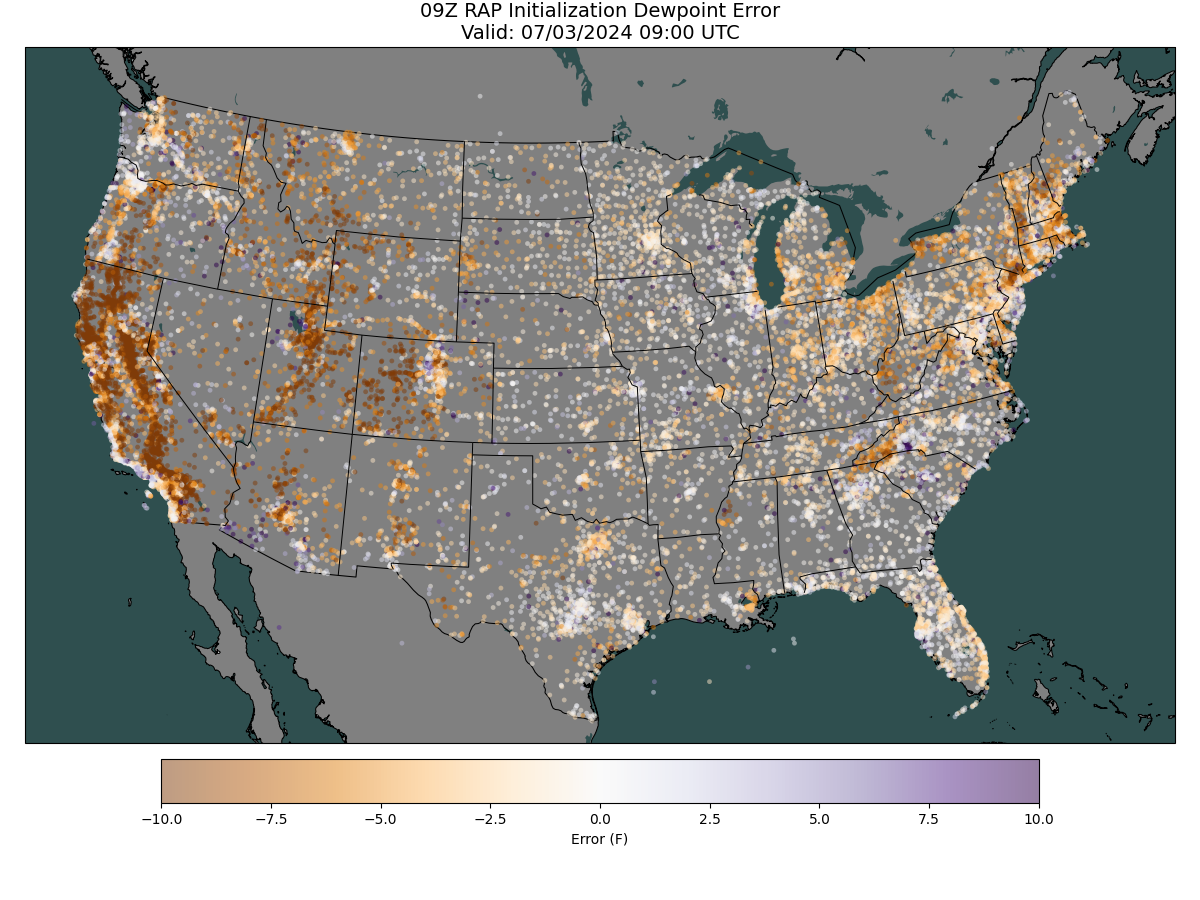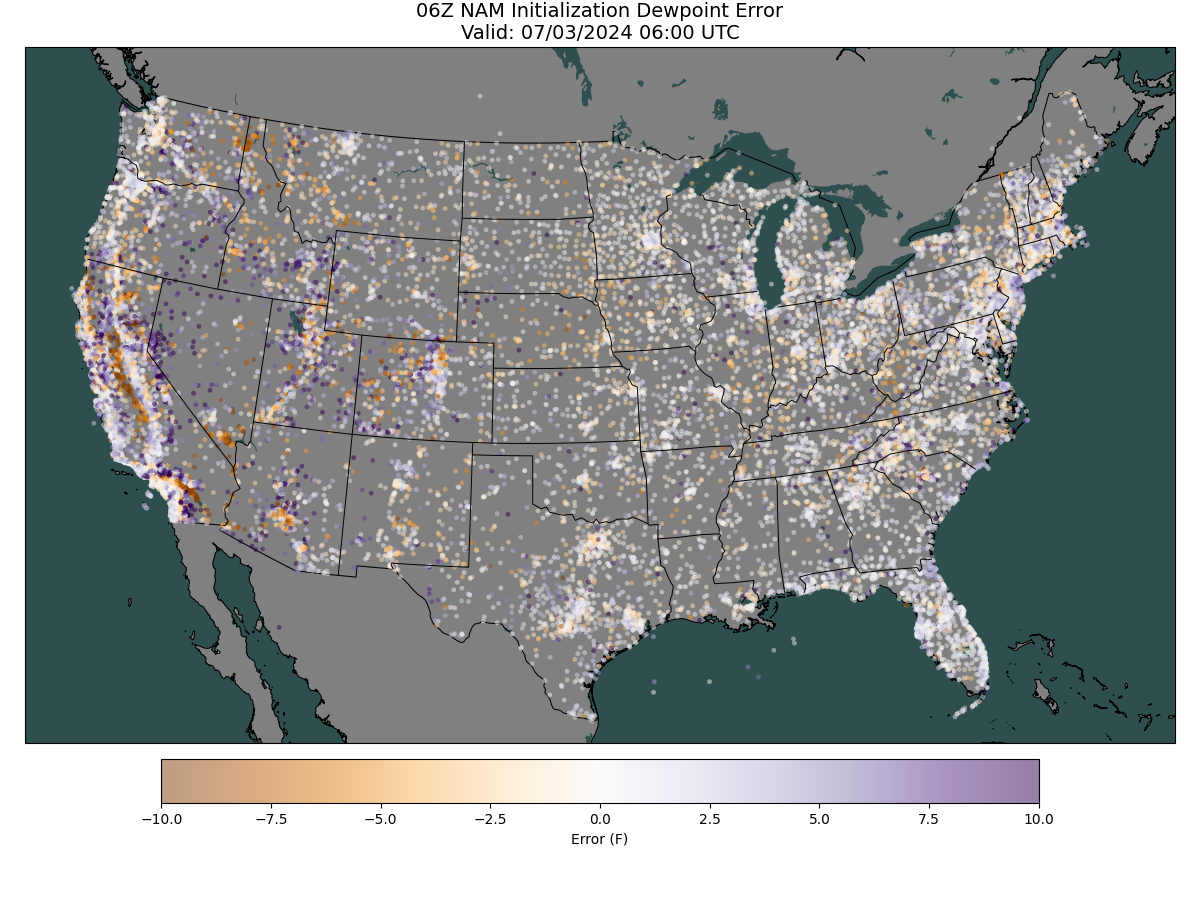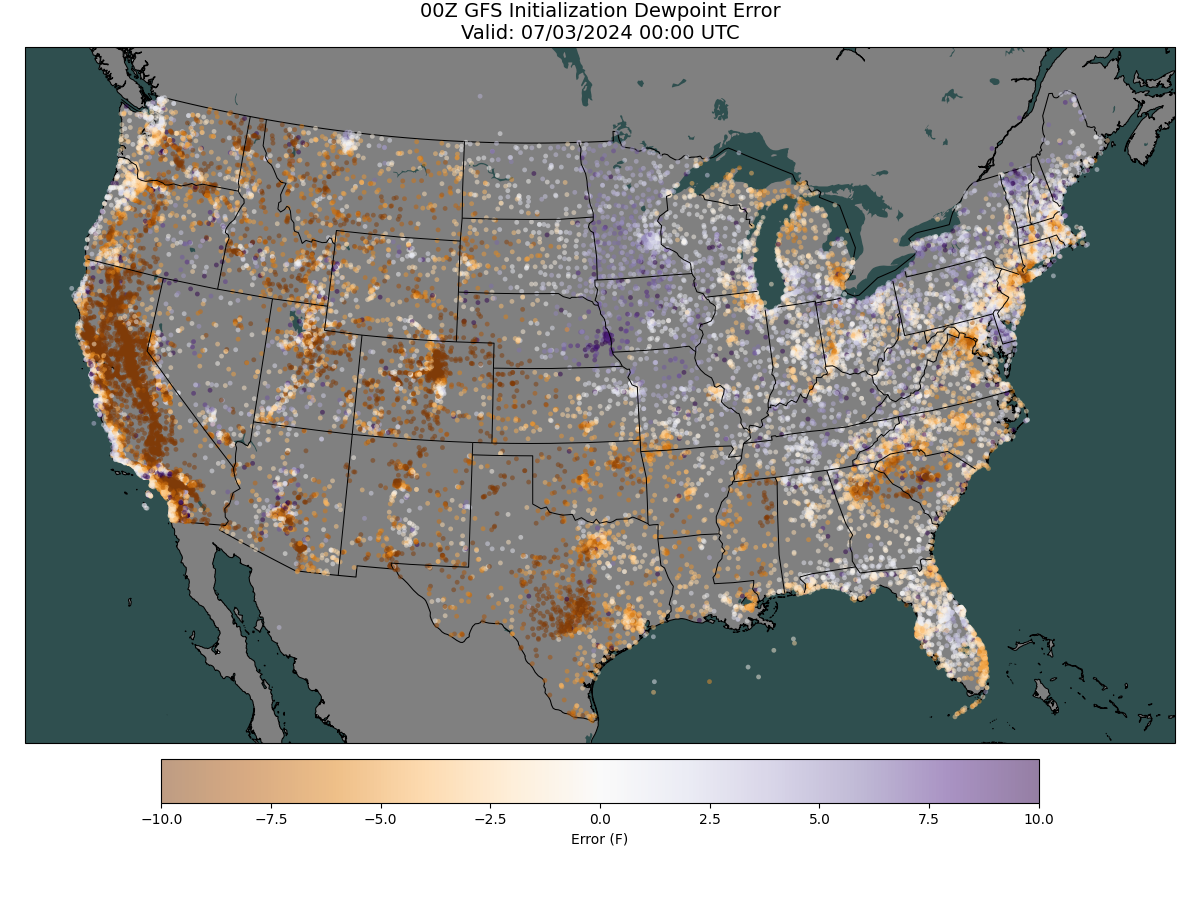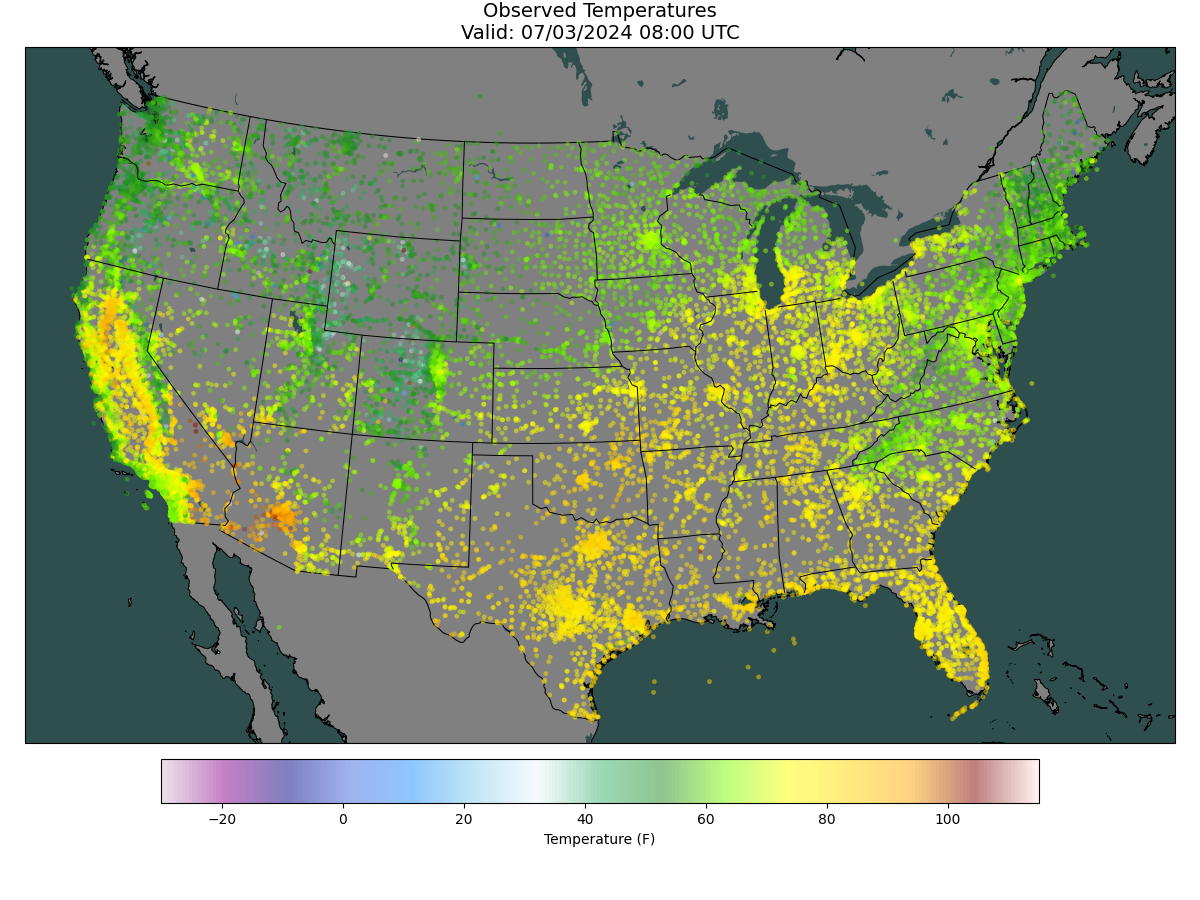
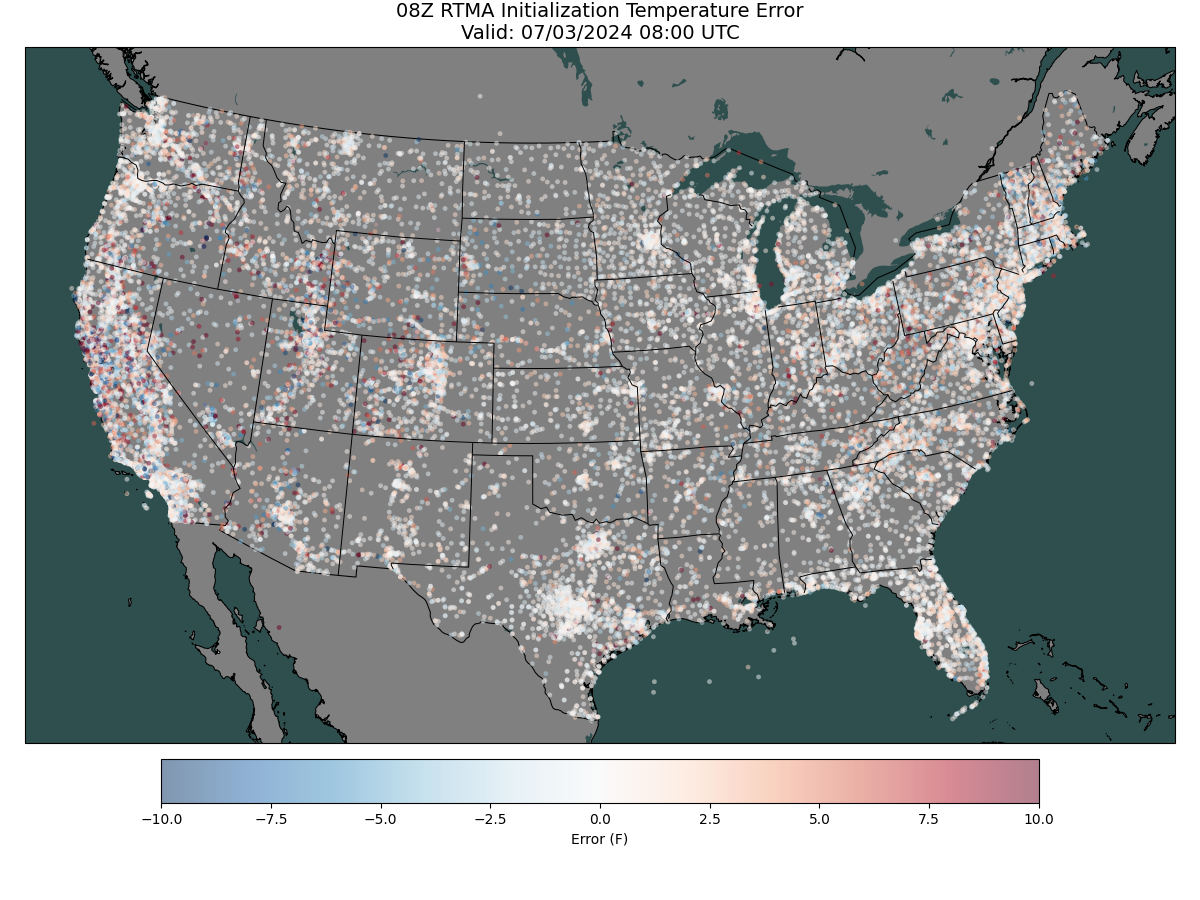
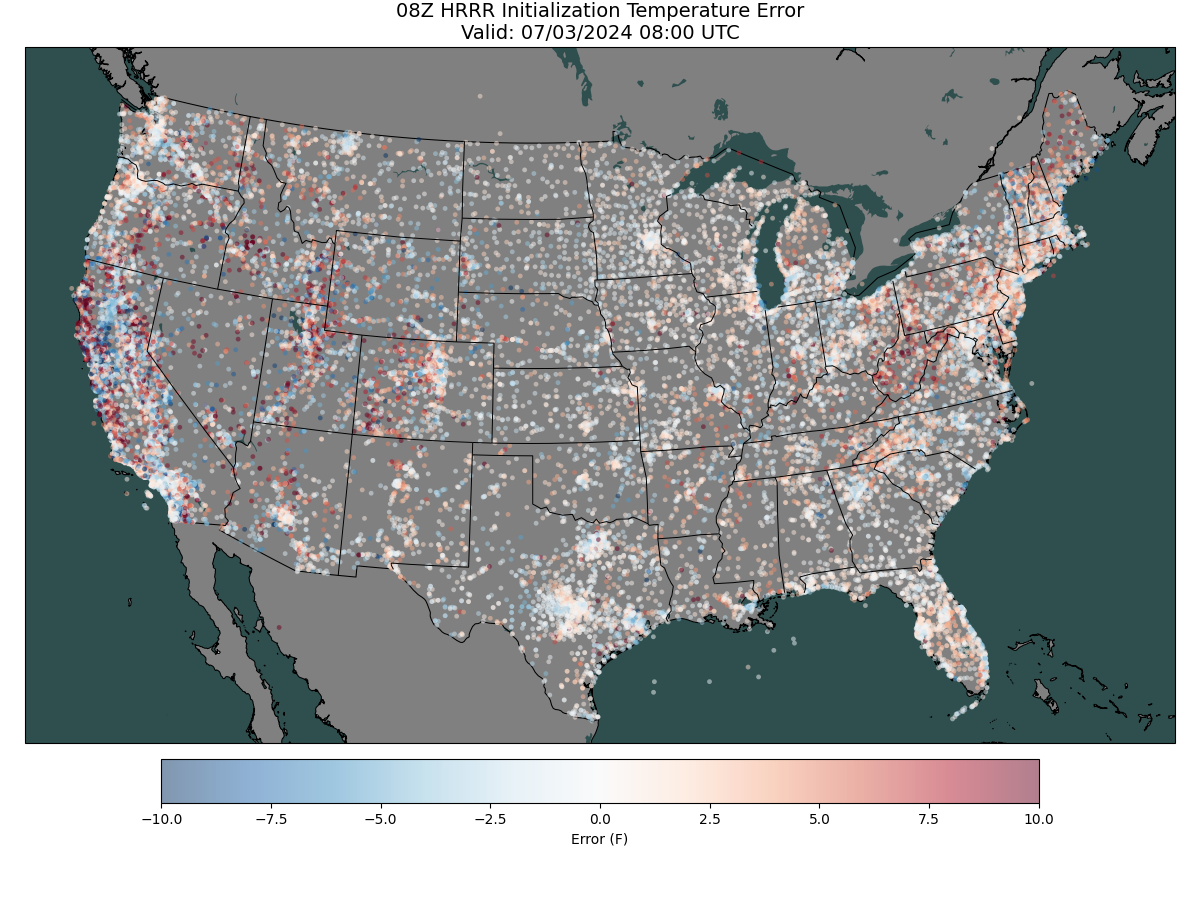
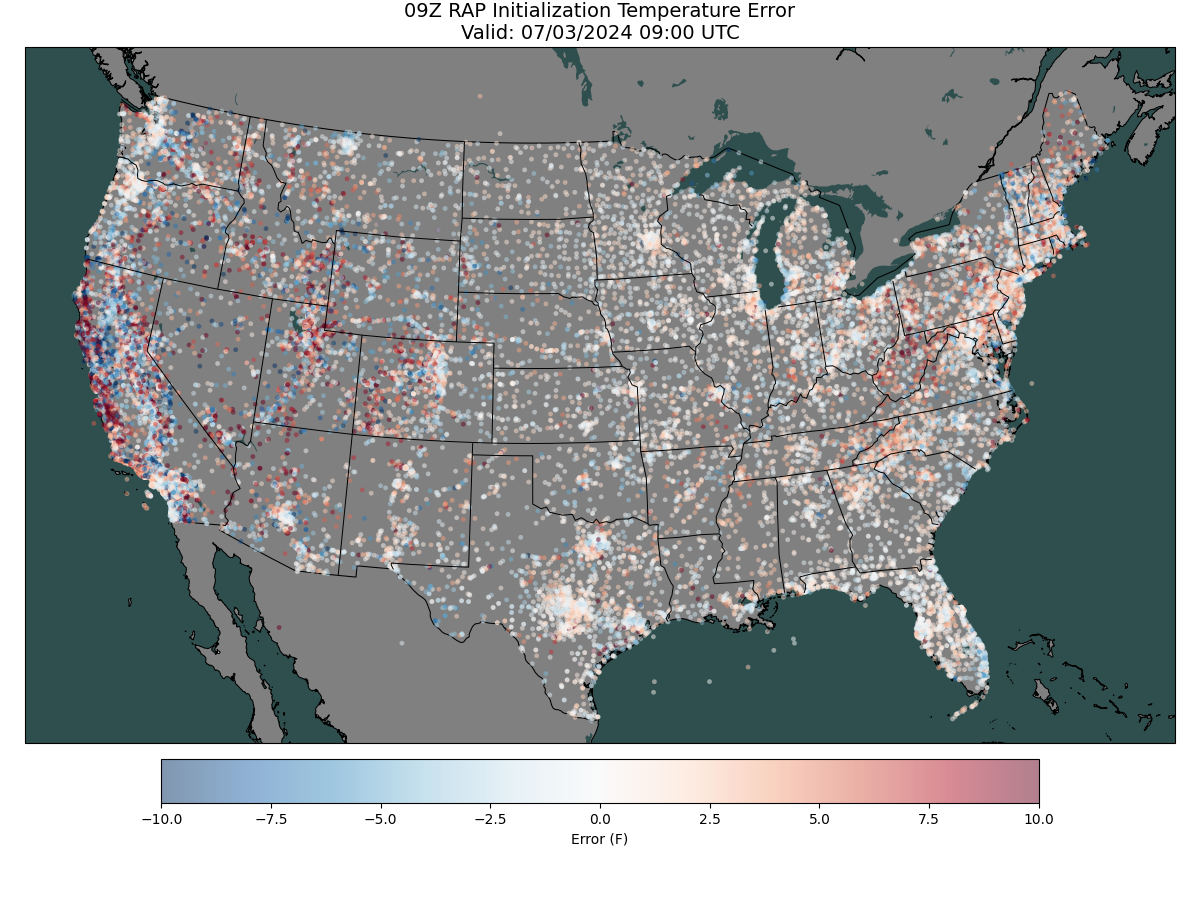
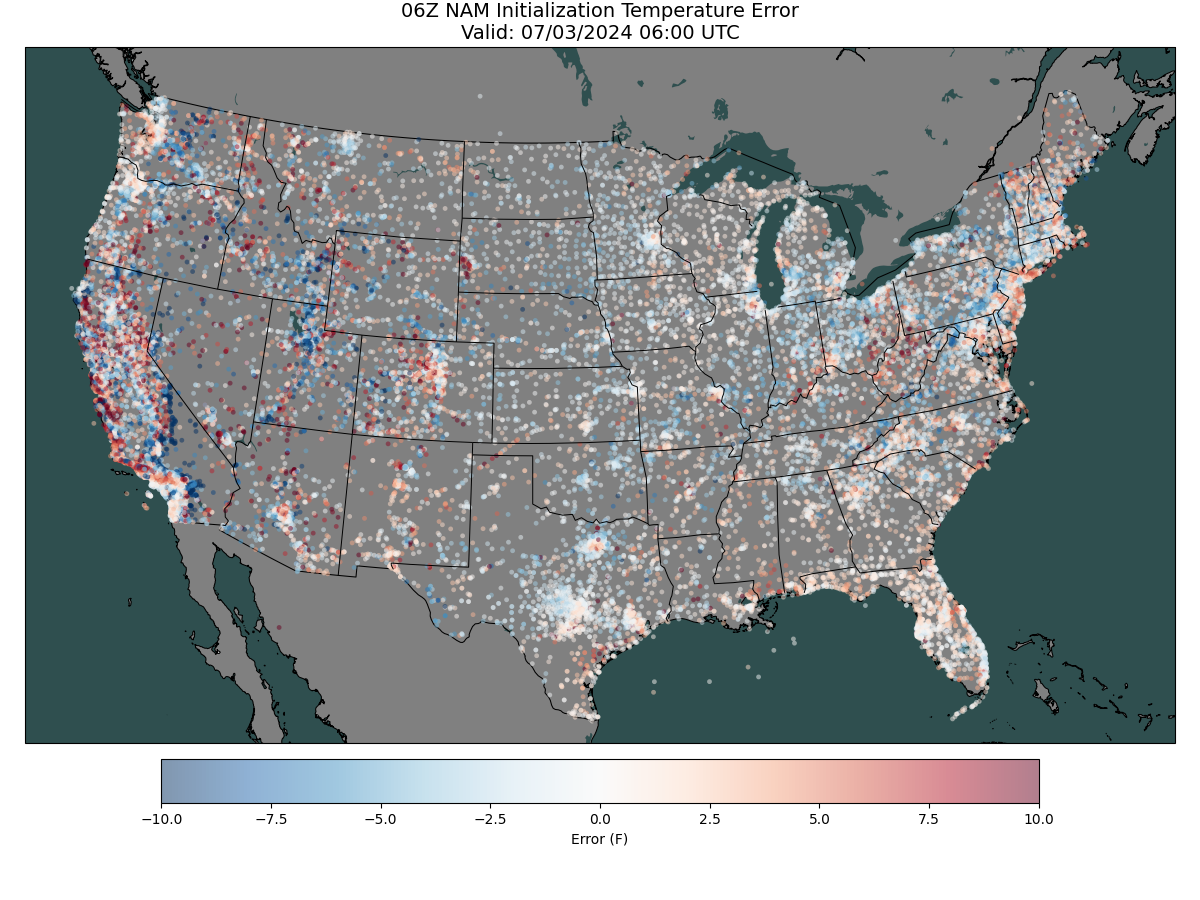
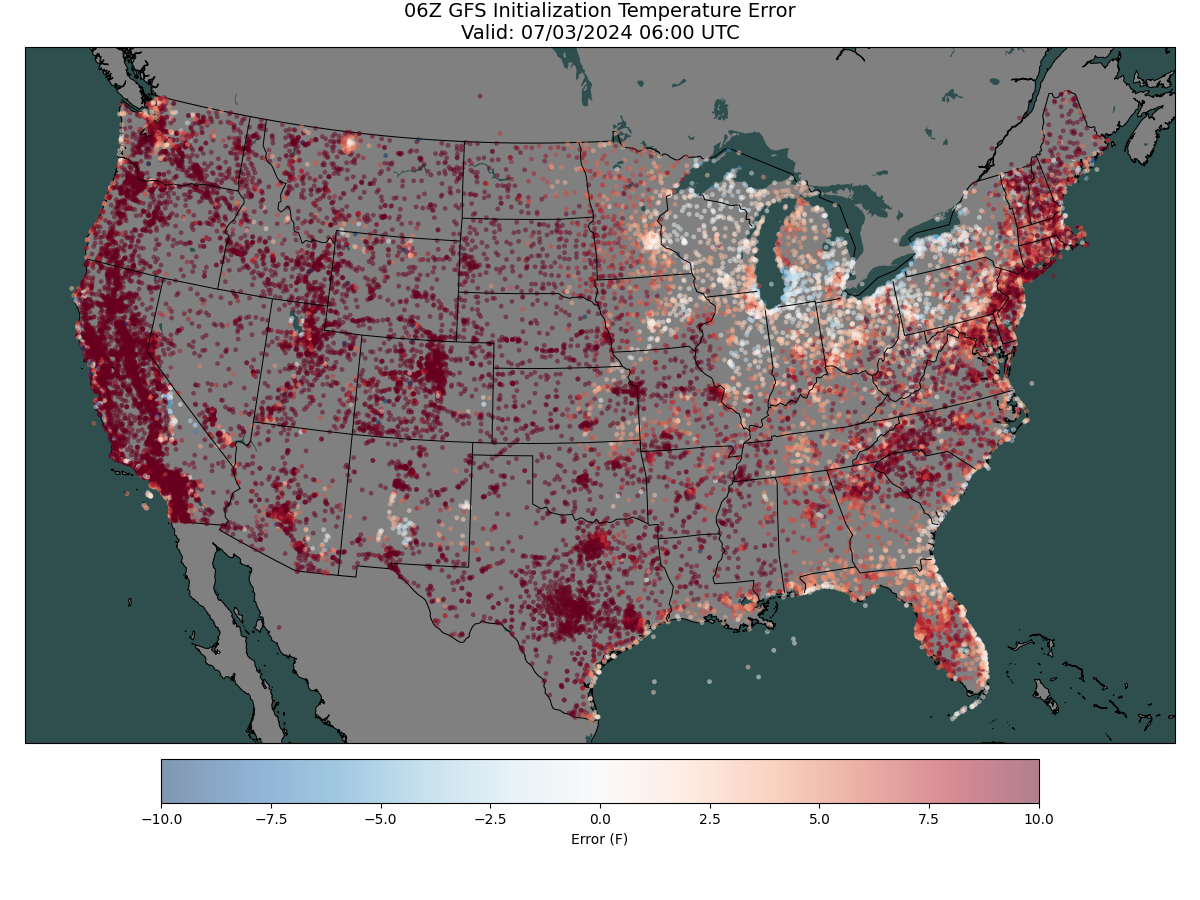
The plots below show the errors in each model initialization as compared to actual surface observations. These errors are calculated by taking the temperature and dewpoint field from each model and interpolating the field to each surface station. A simple difference is then computed and plotted. Please note that no QC'ing of the surface observations is performed, so erroneous observations may display as large errors in the analysis. These plots are updated hourly for the HRRR, RAP, and RTMA based on the latest model run available on the THREDDs server, and every 6 hours for the NAM and GFS. Surface observations are provided by Synoptic Data. Click on an image to enlarge.


